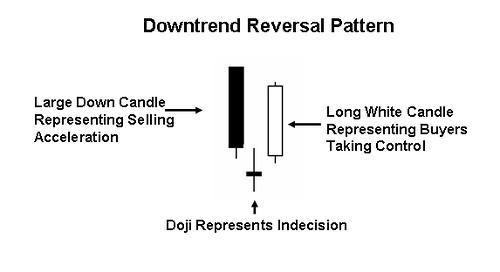
A Doji candlestick, also known as the Doji candle, is a specific formation on a trading chart that has even more specific signals. It indicates that the market is in a state of indecision where no one side, neither bulls nor bears, have an upper hand over the other.
While it’s not very useful on its own, using a Doji candle in a tandem with other technical indicators, such as moving averages or oscillators, can introduce more clarity into your trades.
Follow along to find out more about what this formation is and how you can make the most of it.
Doji candles – Where do they fall in the technical analysis category?
Technical analysis is one of the most popular methods used by traders to predict future price movements and increase the profitability of their trades.
Even before talking about a Doji candle Forex traders can use, there are lots of technical indicators that help people identify various patterns and price repetitions that may actually occur in an upcoming price shift. This is why there are hundreds and even thousands of different technical indicators that continue to increase in number to this day.
As for Doji candlesticks themselves, they’re just price patterns that occur on a candlestick chart. Ultimately, by adding other technical indicators into the equation, traders can get a pretty clear picture as to where the new trade will occur.
What exactly is a Doji candle?
So, what is a Doji candle anyway? As we have already noted before, it is a price pattern that occurs on a candlestick chart and indicates a specific movement of the market. For better understanding Doji candles, we need to explain what a candlestick chart is in the first place.
A candlestick chart
The candlestick chart is by far the most advanced charting visualization that manages to clearly represent all of the important price points on a 2D plane.
Basically, a candlestick chart is the combination of line and bar charts and offers not only a linear movement of the closing prices but also the rest of the other three main prices: the opening price, as well as high and low prices of the day.
With such an insight into the market movement, traders can better plan out their next moves and eliminate as many mistakes as possible.
A Doji candlestick chart pattern
So, after covering all pre-requisites, it’s time to actually explain what the Doji candle meaning is. A Doji candlestick is basically a price pattern that pops up when the opening and closing prices of a certain asset are pretty much in the same spot.
For that reason, both vertical and horizontal lines of a Doji candlestick are very thin. In contrast, a regular candlestick bar only has one thin line – the vertical one; The horizontal line has a certain thickness to it, depending on how far apart the opening and closing prices are from one another, which, as you already know, is almost non-relevant with a Doji candle chart.
So, as noted earlier, a Doji candle occurs when the opening and closing prices are closer to each other. It can go in either of these directions:
- The market opens with the bulls pushing up the prices, yet the bears put up resistance and push down the price at its opening position;
- The market opens with the bears pushing down the prices while the bulls resisting and pushing up the prices to the original position.
Either way, a Doji candlestick pattern tells us that the market has tried out both directional trends and has finally stabilized in the original opening spot without “committing” to either bulls or bears.
The main elements and various types of a Doji candle
We have said earlier that there are two main lines in a Doji candle: vertical and horizontal. The vertical line is called the wick, whereas the horizontal line is called the body. Depending on how high the highest price of a day and how low the lowest price of the day was, the wick will vary in length – the further apart the two prices are, the longer will the wick be.
As for the body, it’ll always have the same width/thickness. As for the height of the body, it’ll vary depending on the exact placement of opening and closing prices of the bar, hence producing four different Doji candle patterns:
- Common (Neutral) Doji
- Long-legged Doji
- Gravestone Doji
- Dragonfly Doji
Let’s take a closer look at each of these patterns and see what they actually represent.
Common Doji
The first pattern in our list is the Common Doji, which is also known as the Neutral Doji. It is the most common pattern for Doji because it is positioned in the exact middle of the day’s high and low – the wick. Therefore, the market has gone up and down during the course of the day, yet the opening and closing prices have stabilized somewhere in their center, which is to say that there is absolutely no clear trend to be seen here.
Long-legged Doji
The second entry in the Doji candle types is the Long-legged Doji. It is fundamentally similar to the Common Doji pattern in that the body is also positioned in the center of the bar. However, unlike the Common Doji, the day’s high and low prices are much further apart, meaning that there was a larger shift in the asset price over the course of the day.
Gravestone Doji
Next up, a Gravestone Doji. This particular pattern forms when the opening and closing prices equalize at the very low of the day. Once again, it indicates that the bears and bulls are in equilibrium at that exact moment. However, with a Gravestone Doji, we’re already seeing the specks of a trend. It forms at the very bottom of the downtrend, meaning that there might be a price reversal coming.
Dragonfly Doji
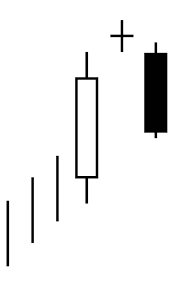
Contrary to the Gravestone Doji, a Dragonfly Doji is more of a Doji candle bearish pattern that forms at the very top of the wick. While it still implies that the two market forces have no clear dominance over each other, a Dragonfly Doji still shows that for the whole day, bears of the market have been pushing the price down while the bulls didn’t really have an upward trend. Therefore, this particular pattern may indicate that the upward trend is at its peak and the price may start going down.
One small Doji candle example
Here’s a small example of a Doji candle pattern:
Let’s say you’re trading company shares and see the formation of a Doji candlestick stock. It’ll look like this: the opening price for the day might be at $103.40. In the course of the day, the asset will post a bunch of different prices, both high and low. The highest price will be at, say, $106.90, whereas the lowest price will be at $100.10. At the end of the day, the price will close at $103.30, which is pretty much the same as the opening price.
This is an example of more of a Long-legged Doji rather than a Common Doji as the high and low prices are further apart from each other.
How to trade with Doji candles explained
So, whenever you see a bullish or a bearish Doji candle, what should be your next course of action? Well, as we have already pointed it out, there is no apparent trend to be seen with these patterns as they equalize in the same spot as the market has opened.
Therefore, to balance out the uncertainty element of this pattern, traders can introduce various technical indicators to confirm either a trend reversal or the continuation of one. For instance, a specific momentum indicator, such as the stochastic oscillator, can help you determine whether the current trend may go in a reverse direction.
Momentum indicators track the speed, as well as the momentum of the market trend in a specific time period. So, the tandem of the Doji candle indicator can produce a more accurate understanding of the current market trend, as well as whether its strong enough to continue on that trend or whether its time for a price reversal.
Go with CFDs, instead of spot assets
Another useful tip for trading with Doji candles is to choose an asset that can really maximize its effects. So, let’s say you want to incorporate the observations you’ve made with a Doji candle into your Gold trade. Now, were you to trade the actual asset, you would only be able to buy it on the market; selling it would be possible if you owned Gold in the first place. So, it goes without saying that you are limited in which position you can take when a Doji candle says that there’s a specific trend forming.
But if you were to choose Contracts for Difference (CFDs), a bearish or bullish Doji candle would be so much more useful. Since you’re trading contracts, instead of spot assets, you can place both long and short positions at any time without owning an asset. Therefore, regardless of whether there is a reversing uptrend or a downtrend, you can hop on the train and make the most of your Doji candle analysis.
Doji candlestick definition – What did we learn?
Charts are among the most integral elements of any trading market. They represent current price movements, save prior ones, and help people predict future fluctuations more or less accurately.
Among some of the most popular chart types, a candlestick chart is an absolute A-lister because of its complex nature and the ability to represent the most important price movements of the day. And that’s where the Doji candlestick definition chicks in:
A Doji candle is a price pattern seen in a candlestick chart. It occurs when the opening and closing prices of the day equalize in the same position. When that happens, it can be deduced that the market has explored both bullish and bearish trends and has returned back to the original spot without actually committing to any of the sides.
As we noted in the article, a Doji candle on its own cannot be sufficient to help you get an idea of where the next price trend will occur. It literally shows the market in its state of indecision, uncertainty. Therefore, traders use it in combination with other technical indicators to confirm new trends or the continuation of the current ones.


Comments (0 comment(s))